

Real-Time Performance Dashboards
See the financial impact as it happens. Every vendor optimization initiative is tracked against projected savings and tied directly to EBITDA improvement metrics. Live portfolio dashboards make it easy to monitor cost reduction progress across your portfolio.
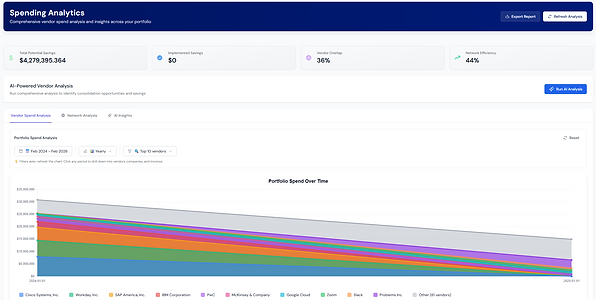
Live Portfolio Dashboards
Cost Reduction Progress Monitoring
Real-time visibility into vendor optimization across all portfolio companies
Track savings initiatives from conception through realization and impact
Savings Validation & Reporting
Verify actual savings against projections with detailed audit trails
Executive-Ready Analytics
Pre-built reports and visualizations ready for board presentations
EBITDA Impact Tracking

Track every optimization directly to EBITDA impact. Our platform quantifies savings opportunities and provides real-time dashboards showing cost reduction progress.
Direct EBITDA Mapping
Every cost reduction initiative is directly tied to EBITDA impact metrics
Savings Quantification
Automatically calculate and track savings opportunities across all initiatives
Real-Time Dashboards
Live tracking of cost reduction progress with instant updates
Value Creation Metrics
Demonstrate proven value creation across every portfolio company investment with comprehensive metrics and LP-ready reporting.
Comprehensive Metrics
Track ROI, payback periods, and value creation across all optimization initiatives
LP-Ready Reporting
Pre-formatted reports and visualizations designed for limited partner communications
Proven Value Demonstration
Show clear evidence of value creation and return on optimization investments
Portfolio Analytics

Compare performance across portfolio companies with cross-portfolio benchmarking and identify top performers and optimization opportunities.
Cross-Portfolio Benchmarking
Compare your spend patterns against similar companies in your portfolio
Top Performer Identification
Identify and learn from highest-performing portfolio companies
Opportunity Identification
Spot underperforming areas and high-impact optimization opportunities
Measurable Results You Can Show LPs
Every optimization initiative is tracked with detailed financial metrics. From cost reduction progress to EBITDA improvements, you'll have executive-ready analytics that demonstrate clear ROI to limited partners and stakeholders.
Comprehensive tracking of all financial KPIs related to vendor optimization
Show proven return on investment with clear, auditable metrics
Detailed Financial Metrics
Clear ROI Demonstration
Executive-Ready Reports
Professional reports and visualizations designed for LP presentations